Analysis of financial statements is the backbone in making sound business decisions, as it gives important information on the financial soundness of a company and the trend it is following, as well as the future outlook. As an accountant compiling reports to clients, a CFO considering options on investments, or the owner of a business keeping tabs on the profitability of the same, the ability to analyze the financial data decisively and rather quickly could prove to be the difference between success and failure.
The development of financial analysis programs has changed the pattern in which organizations use their financial information. The new tools have gone beyond the basic spreadsheet evaluation to include complex analytics, automatic insights, and live reporting features. These systems are able to make sense of huge financial data within seconds, find trends that could take hours to recognize with human efforts, and display complicated reports easily through consumable visualizations.
The guide will also have detailed information about the 10 best financial statement analysis tools in 2025, their functionality, advantages, and application opportunities. We are going to consider such aspects as the accounting-integrated solutions that are best suited to small companies and the enterprise-oriented platforms in the service of large companies. The respective tools will be compared in terms of accuracy, integration features, ease of using the tool, and value-addition in order to determine where you can get the right fit tool to meet your financial analysis requirements.
What are Financial Statement Analysis Tools?
Financial statement analysis toolS are a type of software that analyze and document data contained in the most important financial statements—the balance sheet, the income statement, and the cash flow statement—in order to provide effective information. In contrast to the simple accounting tools, these sites provide such advanced functions as automated ratio calculations, detection of trends, benchmarking, and forecasting.
They also display a chart- and dashboard-based view of financial health, facilitate automated reporting, and are compatible with accounting systems, allowing inherent flow of data. The tools assist companies in monitoring their performance, identifying problems, and making financial decisions in a short amount of time.
Key Criteria for Choosing Financial Statement Analysis Tools
When one considers the financial statement analysis tools, there are a number of important factors that decide their effectiveness and applicability to various organizations.
- Usability and dashboard design impact daily user experience. User-friendly controls, customizable dashboards, and intuitive menus allow reading everything one needs in a few clicks. The tool must suit both financial professionals and businesspeople without necessarily much accounting knowledge.
- Price-to-Value Ratio considers both subscription costs and the value delivered. This entails an assessment of the capabilities of the tool regarding its value and rationality and generating sufficient returns on investments in terms of efficiency and insights.
- Security and Compliance Features help to make sure that confidential financial data can be secure and that the tool is compliant with the regulations. It incorporates data encryption, controls to access, audit trails, and conformity to standards such as SOX, GAAP, and IFRS.
- Accuracy and depth of analysis stand as the most crucial criteria. The tool ought to have the capacity to bootstrap accurate calculations and sophisticated ratio analysis and allow for the facility of analysis compared to reporting. This will enfold the ability to deal with complex financial structures and coordination of multi-entity mergers, besides industry requirements.
- Integration capabilities determine how well the tool works with existing systems. The good integration with other popular accounting software, including QuickBooks, Xero, NetSuite, and SAP, will ensure that the data is synchronized in each of the systems, and it will also mean less involvement of manual work. These integrations influence the efficiency and accuracy of data.
- Reporting and data visualization capabilities determine how effectively insights are communicated. Digitalized tools also enable complex charting, report tailoring, and automation of their delivery, which ensures that financial analysis is carried all the way to the key stakeholders in acceptable forms.
- Forecasting and Modeling Capabilities Separate basic reporting tools from advanced analysis platforms. Scenario modeling, budget variance analysis, and predictive analytics are such features that allow an organization to see the future instead of focusing on the past.
Top 10 Financial Statement Analysis Tools (2025)
1. QuickBooks Advanced Reporting
Website: https://quickbooks.intuit.com/

QuickBooks Advanced Reporting is one of the most powerful financial statement analysis tools that make it possible to analyze their financial data in depth, customize reports, and be able to combine meaningful financial data. It extracts current accounting information and subsequently allows filtering, sorting, and visualization of key indicators with the help of an Excel-like interface.
It is perfect for medium and small companies that already use QuickBooks and makes it possible to monitor KPIs, analyze trends, and forecast cash flow. It also offers actionable insights with no extensive technical expertise to draw on, FileName. Built-in templates, drag-and-drop customizations prevent the need to add supplementary supplies, third-party services, or integrations.
Key Features:
- Real-time financial ratio calculations and trend analysis
- Automated variance analysis and budget comparisons
- Customizable KPI dashboards with drill-down capabilities
- Industry benchmarking against peer companies
- Automated report scheduling and distribution
- Cash flow forecasting and scenario modeling
Best For:
Small to medium-sized businesses using QuickBooks that need enhanced analytical capabilities without switching platforms.
Pros:
- Seamless integration with existing QuickBooks data
- User-friendly interface familiar to QuickBooks users
- Comprehensive ratio analysis and benchmarking
- Affordable pricing for SMBs
- Strong customer support and training resources
Cons:
- Limited customization compared to standalone tools
- Requires QuickBooks subscription as foundation
- May lack advanced features needed by larger enterprises
- Reporting options can be restrictive for complex needs
Pricing Overview:
Starting at $19/month as an add-on to QuickBooks subscriptions, with enterprise options available at higher tiers.
2. Fathom
Website: https://www.fathomhq.com/
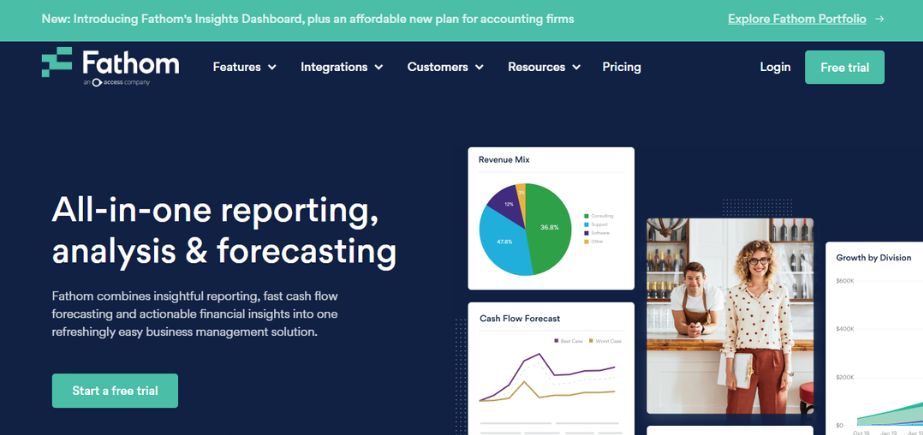
Fathom management reporting and financial analysis software is a cloud-based intelligence tool that is designed to be used by accountants, CFOs, and business advisors. It also works with platforms such as QuickBooks, Xero, and MYOB to convert the raw financial information into dashboards, KPI scores, and benchmarking reports in a visual manner.
Fathom is a strong consolidation engine, scenario planning, and trend analysis engine. Its exceptional strength is presentation-ready reporting, such that it is most suitable when providing client-facing insights. It is both easy to use and highly dynamic; it allows the financial story and strategic decision-making to be done by expanding businesses.
Key Features:
- Award-winning data visualization and dashboard design
- Automated KPI tracking and performance monitoring
- Advanced trend analysis and forecasting capabilities
- Multi-entity consolidation and reporting
- Client portal for accounting firms
- Industry-specific templates and benchmarks
Best For:
Accounting firms, CFOs, and business advisors who need to present financial insights to clients and stakeholders in compelling formats.
Pros:
- Exceptional visualization and design quality
- Strong focus on storytelling with data
- Excellent multi-client management for accounting firms
- Comprehensive benchmarking database
- Regular feature updates and improvements
Cons:
- Higher price point than basic alternatives
- Learning curve for advanced features
- Limited integration options compared to some competitors
- May be overkill for simple analysis needs
Pricing Overview:
Plans start at $53/month for single entities, with multi-client and enterprise options ranging from $180-$720/month.
3. Zoho Analytics
Website: https://www.zoho.com/analytics/
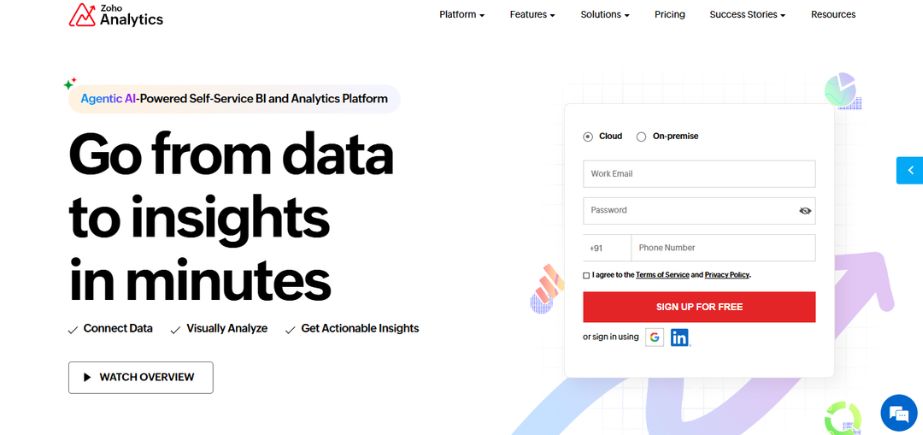
Zoho Analytics is a business intelligence and self-service analytics solution that is financially oriented. It enables its users to integrate data sourced from Zoho Books, Excel, or third-party accounts to create custom dashboards and financial reports. It allows taking a proactive approach to financial management with AI-driven insights, trend forecasting, and alerting. Zoho Analytics is the best tool for companies that require cross-functional and multi-source integration of financial analysis. It has a drag-and-drop style, and the pricing is low; hence, suitable for companies of any size.
Key Features:
- Drag-and-drop report builder with advanced analytics
- AI-powered insights and anomaly detection
- Multi-source data integration and blending
- Advanced forecasting and predictive modeling
- Collaborative features and report sharing
- White-label options for resellers
Best For: Growing businesses and consultants who need flexible, customizable financial analysis without enterprise-level complexity.
Pros:
- Highly customizable dashboards and reports
- Strong AI and machine learning capabilities
- Extensive integration options
- Competitive pricing structure
- Good mobile accessibility
Cons:
- Can be complex for non-technical users
- Learning curve for advanced features
- Limited financial-specific templates
- Support quality varies by plan level
Pricing Overview:
Free tier available; paid plans start at ₹960/month for basic features, with advanced analytics starting at ₹15850/month.
4. FreshBooks Reports
Website: https://www.freshbooks.com
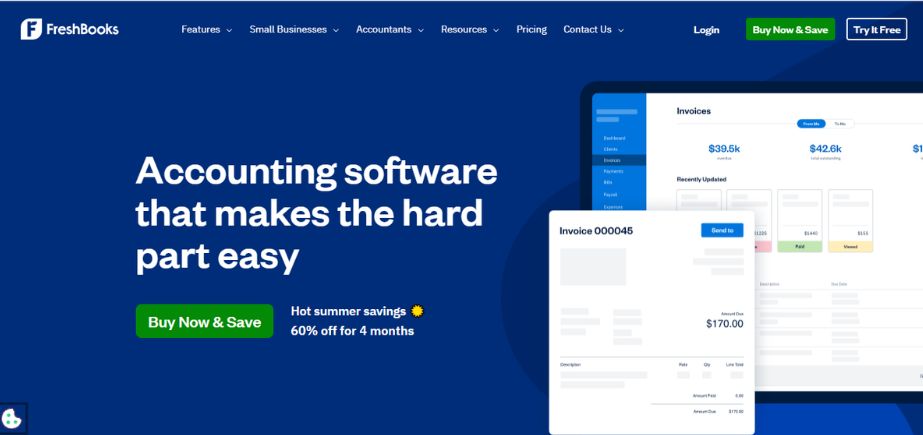
FreshBooks Reports is an in-house analytics application included in the FreshBooks accounting software, aimed at the needs of freelancers, small companies, and service providers. It provides critical views of financial statements such as profit and loss, expense details, tax reports, and accounts aging. Alongside financial tools, businesses often use the best employee management software to manage teams and operations efficiently. It is easier to use than enterprise tools, and its insights, visualizations, and stories in real-time enable non-accountants to instantly see how the business is doing. Ideal for the points of clarity and speed, FreshBooks reports are best when a decision maker has our preference.
Key Features:
- Automated profit and loss tracking with trend analysis
- Project-based profitability analysis
- Time tracking integration for service businesses
- Customizable financial dashboards
- Expense categorization and analysis
- Tax preparation support and reporting
Best For:
Service-based businesses, freelancers, and small companies that need integrated time tracking and project profitability analysis.
Pros:
- Excellent for service-based business models
- Integrated time tracking and project management
- User-friendly interface with minimal learning curve
- Strong mobile app functionality
- Good customer support and onboarding
Cons:
- Limited advanced financial analysis features
- Primarily suited for smaller businesses
- Fewer customization options than specialized tools
- Limited industry benchmarking capabilities
Pricing Overview:
Included with FreshBooks subscriptions starting at $8.40/month, with advanced features available in higher-tier plans.
5. Xero Analytics Plus
Website: https://www.xero.com/accounting-software/analytics/
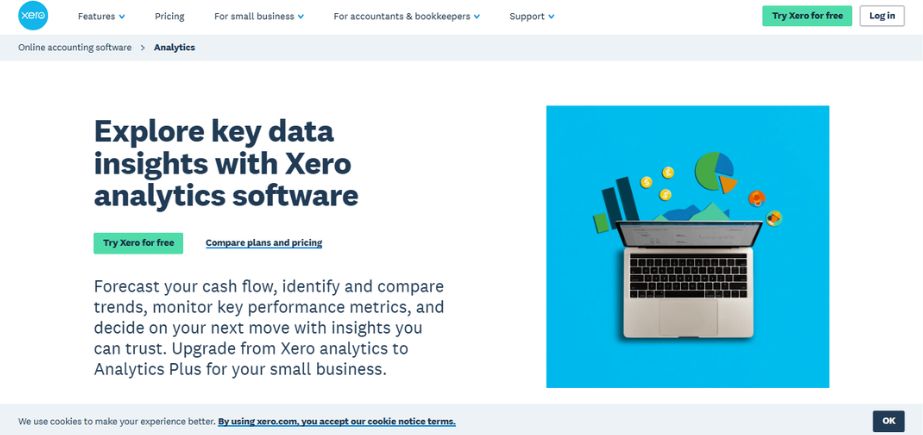
Xero Analytics Plus provides intelligent analysis capabilities on top of the Xero accounting system, helping the user predict the cash flow, trends, and other important financial KPIs. It is best suited when small and mid-sized companies need to plan in real-time, when considering scenarios. They can see future financial health with interactive graphs and custom reporting and prepare in advance. No manual holes with an all-time connection to the Xero core accounting system. It can be particularly helpful to deal with seasonal patterns or when it comes to funding negotiations.
Key Features:
- Real-time financial reporting and KPI tracking
- Advanced budgeting and forecasting tools
- Multi-dimensional reporting and analysis
- Automated variance analysis and alerts
- Integration with Xero’s extensive app ecosystem
- Collaborative planning and reporting features
Best For:
Xero users who need enhanced analytical capabilities while maintaining their existing accounting workflow.
Pros:
- Seamless integration with Xero accounting data
- Real-time reporting and analysis
- Strong budgeting and forecasting capabilities
- Extensive third-party integrations
- Regular updates and new features
Cons:
- Requires Xero subscription as foundation
- Limited customization compared to standalone tools
- May lack depth for complex financial analysis
- Pricing can add up with multiple add-ons
Pricing Overview:
Available as part of Xero’s premium plans starting at $29/month, with advanced analytics features in higher tiers.
6. Spotlight Reporting
Website: https://www.spotlightreporting.com/
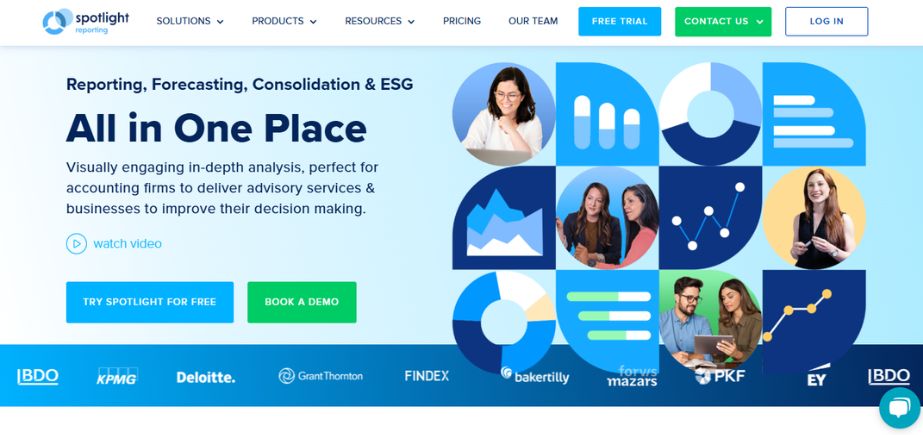
Spotlight Reporting is one of the cloud financial statement analysis tools that enables global accountants and advisors to carry out financial reporting and forecasting. It works with Xero, QuickBooks, and MYOB to build visual reporting, KPI dashboards, and group consolidated reporting in many entities. Spotlight supports multi-currency and multi-company and is fit for international businesses. It is unique because it has a strong prediction of cash flow and customizable templates that allow users to produce professional-grade board reporting on Technq, information that guides strategic discussions and decisions.
Key Features:
- Professional report templates and branding options
- Automated commentary and insights generation
- Multi-entity consolidation and reporting
- Industry benchmarking and peer comparisons
- Client portal and presentation tools
- Advanced cash flow forecasting
Best For:
Accounting firms, financial advisors, and businesses that need professional-quality financial presentations for stakeholders.
Pros:
- Professional presentation quality
- Strong focus on client communication
- Comprehensive benchmarking database
- Good automation features
- Excellent customer support
Cons:
- Higher price point for advanced features
- Limited self-service options for end users
- Focus on presentation over deep analysis
- Learning curve for template customization
Pricing Overview:
Plans start at $35/month for basic reporting, with professional and enterprise options ranging from $295-$995/month.
7. Tableau
Website: https://www.tableau.com/

Tableau is a primary data visualization and analytical platform for finance teams to analyze and present financial data on scale. Although not product-related, it presents unparalleled customization, and thus is ideal for businesses that require intensive data exploration. Tableau can be linked to nearly any source of data and has the ability to have a multi-dimensional financial suite of dashboards, variance analysis, and models. It has a high-performance visualization engine that enables converting complex reports into visuals that can be understood by the financial executives and other stakeholders involved in financial decisions, to make confident decisions based on the data they rely on.
Key Features:
- Advanced data visualization and dashboard creation
- Powerful data blending and transformation capabilities
- Interactive analytics and drill-down functionality
- Enterprise-grade security and governance
- Extensive connector library for data sources
- Mobile-responsive dashboards and reports
Best For:
Large enterprises and organizations with complex financial analysis requirements and dedicated IT resources.
Pros:
- Exceptional visualization capabilities
- Highly customizable and flexible
- Strong enterprise features and security
- Large community and resource library
- Powerful data processing capabilities
Cons:
- Steep learning curve for non-technical users
- High licensing costs for enterprise features
- Requires significant setup and configuration
- May be overkill for simple financial analysis
Pricing Overview:
Custom pricing
8. Planful
Website: https://planful.com/
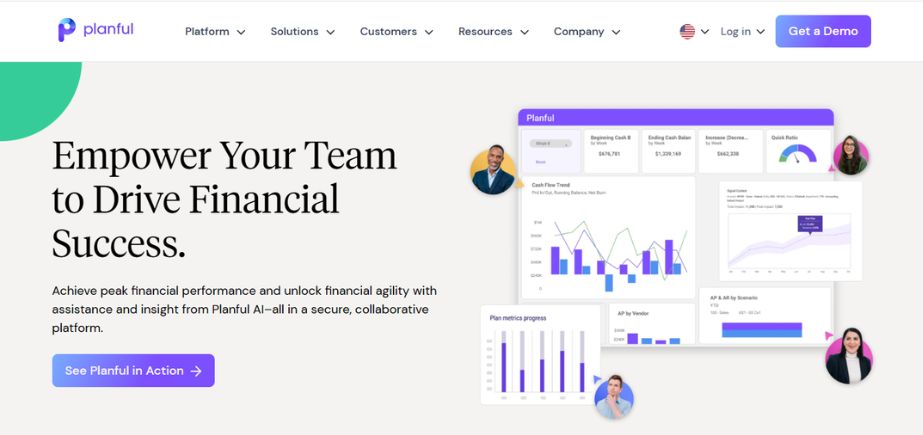
Planful is a financial planning and analysis filed that runs in an enterprise-grade environment, where it simplifies budgeting, forecasting, reporting, and financial close. It has dynamic dashboards, scenario modeling, and collaborative workflows, which make the tool suitable for companies of midsize and above teams in the financial sector. Planful is an AI-inspired system with Excel-like usability that helps make better decisions without losing accuracy and compliance. Integration with ERP systems ensures real-time financial visibility. It is strong with a view to linking performance management with potent, centralized analysis.
Key Features:
- Advanced budgeting and forecasting tools
- Multi-dimensional financial modeling
- Automated consolidation and reporting
- Scenario planning and sensitivity analysis
- Workflow management and approval processes
- Integration with major ERP systems
Best For:
Large enterprises and organizations with complex financial planning requirements and multiple entities.
Pros:
- Comprehensive planning and budgeting capabilities
- Strong enterprise features and security
- Advanced modeling and scenario analysis
- Excellent integration with ERP systems
- Robust workflow and approval processes
Cons:
- High cost and complexity for smaller organizations
- Significant implementation time and resources required
- Learning curve for advanced features
- May require dedicated administrator
Pricing Overview:
Custom pricing
9. Microsoft Power BI
Website: https://www.microsoft.com/en-us/power-platform/products/power-bi

Microsoft Power BI is a business intelligence solution that is adaptable and very common in analyzing financial data. Since it is easy to integrate with Excel, SQL, and ERP systems, it presents real-time reporting, customized dashboards, and predictive analytics features. Power BI enables the finance team to follow KPIs, visualize its cash flow, and identify trends in profit and loss. It is relatively cheap and scalable, and it can be used by companies of any size due to its familiarity with the Microsoft ecosystem. With Power Query and DAX formulas, it can be very powerful.
Key Features:
- Advanced data visualization and reporting
- AI-powered insights and anomaly detection
- Integration with Microsoft ecosystem
- Real-time dashboards and monitoring
- Collaborative features and sharing options
- Extensive connector library
Best For:
Organizations using Microsoft products that need flexible business intelligence with financial analysis capabilities.
Pros:
- Excellent integration with Microsoft ecosystem
- Strong AI and machine learning features
- Competitive pricing structure
- Large user community and resources
- Regular feature updates and improvements
Cons:
- Learning curve for advanced features
- Limited financial-specific templates
- Can be complex for simple analysis needs
- Performance issues with very large datasets
Pricing Overview:
Power BI Pro starts at $14/month per user, with Premium features available at $24/month per user and Premium capacity options.
10. Cube Software
Website: https://www.cubesoftware.com/
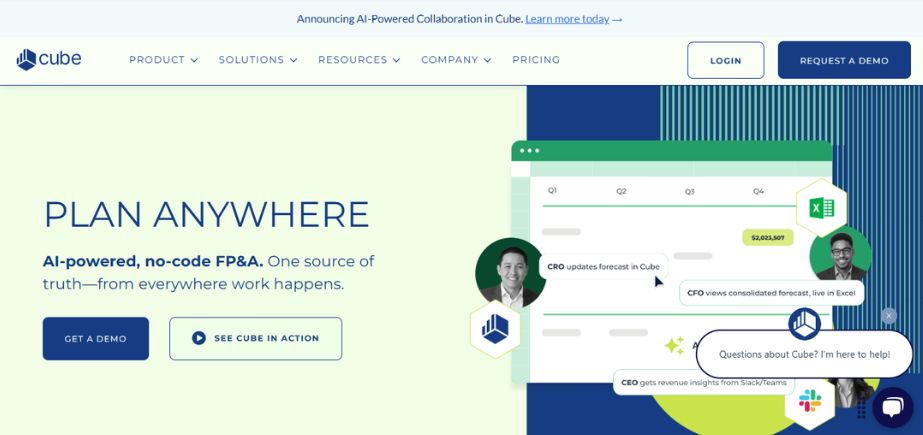
Cube is amongst the new-generation financial statement analysis tools that allows you to augment Excel and Google Sheets by adding modeling and rich data integration and reporting capabilities. It integrates live to both your ERP and CRM systems, enabling the finance teams to create proper forecasting and bespoke reports without having to transition outside of their favorite spreadsheet environment. Cube fits best for growing companies that desire so much to have flexibility by not switching to complicated software. It can be used to support real-time teamwork, scenario planning, and centrally control access to data, making finance processes quicker, more homogenous, and audit-proof.
Key Features:
- Live data connections to accounting systems
- Excel-based financial modeling and analysis
- Automated report refresh and distribution
- Version control and audit trail features
- Collaborative Excel workbooks
- Custom formula and template libraries
Best For:
Finance teams heavily reliant on Excel who want to enhance their existing workflows with live data connections.
Pros:
- Maintains familiar Excel interface
- Excellent for existing Excel-based processes
- Strong version control and collaboration features
- Good integration with popular accounting platforms
- Reasonable pricing for Excel enhancement
Cons:
- Limited to Excel-based analysis
- Requires Excel expertise for full utilization
- May not address broader BI needs
- Dependent on Excel’s limitations
Pricing Overview:
Contact for pricing
Comparison Table Between Different Financial Statement Analysis Tools
| Tool | Best For | Key Features | Integrations | Price Range | Standout Benefit |
| QuickBooks Advanced | SMBs using QuickBooks | Real-time ratios, benchmarking | QuickBooks ecosystem | $19-138/month | Seamless QB integration |
| Fathom | Accounting firms, CFOs | Visual dashboards, storytelling | Xero, QuickBooks, MYOB | $53-720/month | Award-winning design |
| Zoho Analytics | Growing businesses | AI insights, customization | 500+ integrations | ₹960-₹15850/month | Flexible and affordable |
| FreshBooks Reports | Service businesses | Project profitability, time tracking | FreshBooks ecosystem | $8.40-26/month | Service-focused features |
| Xero Analytics Plus | Xero users | Real-time reporting, budgeting | Xero app ecosystem | $29-69/month | Real-time Xero data |
| Spotlight Reporting | Professional services | Report templates, client portals | Multiple accounting platforms | $35-295/month | Professional presentations |
| Tableau | Large enterprises | Advanced visualization, flexibility | Extensive connector library | Custom pricing | Powerful visualization |
| Planful | Enterprise planning | Advanced modeling, consolidation | Major ERP systems | Custom pricing | Enterprise-grade planning |
| Microsoft Power BI | Microsoft users | AI insights, collaboration | Microsoft ecosystem | $14-24/month per user | Microsoft integration |
| Cube Software | Excel power users | Live Excel connections, collaboration | Popular accounting platforms | Contact for pricing | Excel-based analysis |
How to Choose the Right Financial Statement Analysis Tools
Based on Company Size and Industry
Small businesses need to focus on the tools that can work interactively with their existing accounting tools. QuickBooks Advanced Reporting, FreshBooks Reports, and Zoho Analytics are software with very good values and best-suited feature sets without excessive complexity.
Medium-sized companies will enjoy the tools, which offer a more advanced analysis and are sufficiently manageable. Fathom, Xero Analytics Plus, and Spotlight Reporting have high-tech features and favorable learning curves.
Enterprises need extensive platforms that should accommodate complex organizations. Microsoft Power BI, Tableau, and Planful have the scalability and incorporated features to conduct analytics on an enterprise level.
Integration with Existing Systems
Integration with your existing accounting software also makes a tremendous difference in finance and accuracy. Desktop applications such as QuickBooks Advanced Reporting and Xero Analytics Plus have the benefit of being more natively integrated, whereas others, such as Zoho Analytics and Tableau, have more general integration with complex environments in mind.
Manual vs. Automated Data Input
Technology-starved organizations ought to focus on the tools with minimal data input. Synchronizing accounting-born data with automated data can also cut errors and time-wasters, and so tools with high automation traits, such as Fathom and Cube Software, are likely too tempting to resist.
Visual vs. Text-Based Reporting Needs
Consider your audience when evaluating reporting capabilities. There are tools such as Fathom and Tableau, which are great at visual storytelling, and those such as Spotlight Reporting are aimed at professional documents. The need for an interactive dashboard or a traditional report will determine the type of tool to use.
Forecasting and Scenario Modeling
Companies demanding highly developed planning capacities ought to focus on tools such as Planful and Tableau that provide the complexity of modeling. QuickBooks Advanced Reporting is an example of an integrated solution that will probably satisfy basic forecasting needs.
Final Recommendations
Having given an in-depth assessment, there are quite a number of financial statement analysis tools that can be selected according to the specific use cases and types of organizations.
For Small Businesses:
No analytic tool offers the best combination of features, ease of use, and price like QuickBooks Advanced Reporting or Zoho Analytics. The tools provide advanced analysis functions without being overly complicated or expensive to the enterprise.
For Accounting Firms:
Fathom and Spotlight Reporting are the leaders in the capabilities to present to clients and present professionally. Both tools are deep in the understanding of the needs of accounting professionals and offer a great client portal and communication tools.
For Growing Enterprises:
Microsoft Power BI and Tableau have all the scalability and advanced features that are required to perform complex analysis. These are weak platforms that can and will expand with your organization and deliver value now.
For Excel Power Users:
The software developed by Cube Software is a perfect solution for those who want to stick to traditional methods of analysis based on Excel but want to enrich their workflow with significant features of automated reporting.
Most of the vendors have free trials and demonstration practices before making a final decision. This practical presentation shows usability problems and functionality gaps that are not visible on the advertisement collateral. As a recommendation, you can begin with a pilot project to test each of the one or two tools and check their functioning in your particular setting.
That is why the investment in a suitable financial statement analysis tool will have its paybacks in greater decision-making, the saving of time, and better insights. Select a device that can accommodate your present needs and that will have the scope to grow and expand in the future.
FAQs
Which are the excellent free financial statement analysis tools?
Most of the tools to be used are subscriptions, but there are multiple tools with significant free options. Zoho Analytics software offers a free version with limited tools for two users. whereas Microsoft Power BI software offers an unlimited free desktop version but limited sharing and research possibilities. To undertake a thorough financial analysis, investment in the paid tool is normally much more cost-effective in terms of time and deeper insights obtained.
Are these tools a replacement for accountants?
The tools of financial statement analysis engage and complement the activity of professional accountants. The tools simplify calculation and give insights, but to interpret the proper way, give strategic planning, and guaranteecompliance, they should be dealt with by human beings. Accountants provide the context, judgment, and expertise that supplement the tool function.
Do financial statement analysis tools pass security standards?
Enterprise-grade security, such as encryption of data, provision of access control, and audit trails, is observed by reputable financial analysis tools. The majority of the tools are in line with the applicable standards such as SOX, GAAP, and IFRS. Nevertheless, organizations are supposed to confirm certain requirements of compliance with the vendors and also configure the proper implementation and training of the users.
Do financial statement analysis tools accept multi-currency and international standards?
The multi-currency reporting capability and being able to support international accounting standards are features of most enterprise-grade tools. Such tools as Tableau, Planful, and Microsoft Power BI are very much globalization-friendly, whereas small tools can be insufficient. During international operations, it is advisable to check with the vendors on necessary, specific requirements.
How good are automated financial insights?
Insights through automation are mostly precise when it comes to regular calculations and trend detection. The quality, however, is out on the quality of data and appropriateness of the configuration of tools. Initially, the automated insights should be checked against the manual calculations performed by the user of the software, and the user should have an understanding of what assumptions automated analyses were made on. It is in the detection of patterns and anomalies that these tools excel, but human interpretation and decision-making have to be applied.
